6.2
- Describe the significance of the global variable index. How was it used in this app? Based on your answer, why might indexing be important in programming? It is used as a way to group certain things together based on a specific variable. In this app, the global variable index links the question with the proper answer and picture. Indexing can be important in programming because it can link things together and keep track of data, allowing it to be accessed easier.
- Using what you have learned about lists and indexing, how might you enhance the app so that it is a multiple choice quiz? Create a list of the available choices that appear on the screen when a certain index is called depending on the question. For example, if the index is one set the question to "What is the color of the sky?" and make the options "blue", "red", "green", or "yellow".
- Choose one of the data sets listed above in Activity section and give a brief description of it. What specifically were the types of data (text, sounds, transactions, etc.) included in the data set you chose? The data set I chose displays the average debt of a college student at graduation from 2004 - 2010. You can view variables such as the annual cost of tuition and fees, if the school is public or private, the enrollment size, the graduation rate, the share of graduates with debt, and the athletic conferences to see if there is a relationship between the variables.
- What new facts did you learn when exploring the data set? As of 2010, Vanderbilt has the lowest average graduation debt out of the three colleges I applied to (Pitt, Purdue, Vanderbilt). Students attending schools with 10,000+ students typically have less graduation debt than lower size colleges. Private schools with a 75-100% graduation rate seem to cost the most money.
- Write a question you have about the data set you chose. Now, convert that question into a hypothesis (a statement) with your prediction about the data. If the college is a private institution, then the student debt will be higher.
- Identify at least one security and/or privacy concern that is associated with the data in the data set you chose? Now that people can easily see how specific colleges relate to indebtedness, they might sway away from certain colleges. It also involves financial transactions that the colleges particiapte in, something they might not want the public to see.
- If your data set included a visualization, explain the purpose of the visualization. How would you change or improve the visualization? The visualization makes it easy for the user to see certain relationships between variables, i.e. Average graduation debt by school size. It compresses all of the data into a single, clearly readable visualization. I would improve it by trying to access more information, making it more up-to-date. It would also be more user friendly if the user could scroll over a data value, and it would give either the college name, the exact values, or both.
- Describe and give an example of the difference between synchronous and asynchronous data access. Synchronous data access allows the user to access the data immediately because it is stored directly on the device, an example of which is TinyDB. Asynchronous data access can be achieved by sending a request to the online database then wait for the info to be delivered, and example of which is FirebaseDB.
- True or False. When an app retrieves data from Firebase, it first requests the data and then it stops whatever it is doing and waits for the data to arrive. Explain. False, the app doesn't completely stop whatever it is doing but instead continues other functions until the data arrives. The components using this might stop, but not the entire app. The user can set a procedure so the app stops while it is waiting.
- One aspect of abstraction is that it helps to reduce details to focus on what's relevatn. How does the use of an external databse in this app help reduce detail in the program? The user doesn't have to completely change the code if they want to change the questions, pictures, answers. They just have to edit the database online instead of rewriting the code. It can also be sent and edited by others. There is not as much finite detail.
- Describe how using a list of lists allowed the Presidents Quiz app to have more variety. It allows the app to be based on multiple choice instead of free response. The creator can add multiple options for the user to chose from when answering the question. These options can be easily changed by the creator.
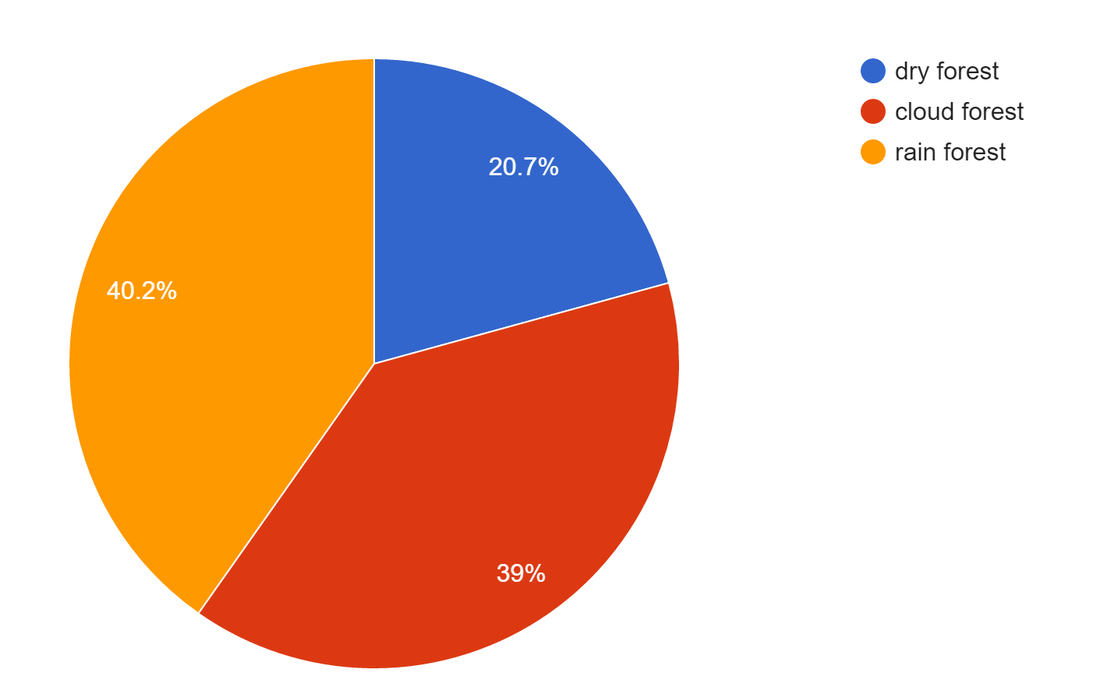
- By filtering and analzying your data set, create a pie chart that displays the relative percentages of cloud forest, rain forest, and dry forest specimens that occur in the data set. Describe the procedure you used to create the pie chart and copy and paste the chart into your portfolio page. The data must be put in the format of Google Fusion Tables. After the data is inserted, you select "Add a chart". Then you select the pie chart version. Then you must choose the data displayed on the chart as "primary eco".